
We use data in our everyday lives. Whether we wear a fitness tracker that counts our steps and measures our sleep quality, or when Alexa announces that it might be time to reorder a frequently-purchased item from Amazon or read product reviews before making a purchase decision, these are all common, everyday examples of how we use data in our daily lives.
In the world of business, we use data to learn more about our customers, improve processes, and help employees do their jobs more effectively. But we haven’t even scratched the surface…
Data versus Gut Instinct
Although proper data analysis involves, well, data, and the whole point behind proper data analysis is using data—facts—to make decisions or understand a problem, we still often rely on our gut instinct. The key is finding the right balance of data and gut instinct when making decisions or solving a problem. Asking the following questions can help:
- What kind of results are needed?
- Who will be informed?
- Am I answering the bigger question?
- How quickly does a decision need to be made?
For instance, if you are working on a rush project, you might need to rely on your own knowledge and experience more than usual. There isn’t enough time to thoroughly analyze the available data. However, if you have plenty of time and resources, then the best decision-making strategy is one that is data-driven.
Data-based Decision-making
One of the most powerful ways to put data to work is with data-driven decision-making. Data-driven decision-making is defined as using facts to guide a strategy. Organizations in many different industries are empowered by data analysts to make better, data-driven decisions.
Data is an extremely powerful tool for good, effective decision-making. It means we are making decisions based on facts. However, if the data is incomplete, misaligned, inaccurate, biased, or even outdated, then it can be misleading. This introduces numerous risks. It can mean we don’t fully solve the problem, solve the wrong problem, or the project fails altogether. In fact, making decisions without data can send an organization off course.
All in all, making the best possible choices and decisions is up to us. You will probably blend data and knowledge in a million different ways throughout your life and career. And the more you practice, the more you will find that perfect blend.
“I’m not a ‘numbers’ person.”
You might think, “data is for scientists, analysts, or nerds”, and I would have been one of them. I have never been a “numbers” person. This was one of the “soundtracks” I have been listening to for years. And the premise isn’t wrong. After studying music theory and modern foreign languages in college, I avoided math, accounting, quantitative reasoning, chemistry, and anything involving numbers like the plague.
However, after managing hundreds of projects throughout my career and working with different types of people—all with unique personalities, perceptions, and even politics—I have witnessed too many instances where decisions were made based on Egos, Opinions, and Emotions (also referred to as EOE), assumptions, biases, or even if someone was in a bad mood that day. These decisions didn’t solve the root of the problem, nor were they aligned with the organization’s strategic goals, leading to inaccurate project performance assessments.
Needless to say, over time, I began using data to measure project management performance and project performance to show stakeholders whether or not a project was truly successful and how the project met a specific goal or better positioned the organization to reach its goals. I wanted to incorporate more structured thinking and more thorough analysis into my project management and business practices, as well as show clients the right way to solve problems and leverage data-based decision-making.
As a result, I have developed a new appreciation for numbers. Even though I found it intimidating, I forced myself to embrace the world of data analysis. And here’s how I did that…
Data Saved My Cat’s Life
So, I began by practicing data analysis in my everyday life, and I started with my cat, Toto.
At the time of this writing, Toto is a 16 1/2-year-old black-and-white male tabby. Toto has had Thyroid disease for nearly seven years. He requires medication every day, twice per day to keep his thyroid levels at a “normal” level and to prevent heart disease. When his thyroid levels are unbalanced, he loses weight, becomes nostalgic, and very sick. Although the medication does a decent job of balancing his thyroid levels, it will also eventually cause his kidneys to fail. As the disease progressed over the years, I’ve had to increase his medication dosage many times, as recommended by multiple veterinarians.
In June 2023, Toto became the sickest I had ever seen him. His fur was thin and patchy, he vomited for nearly four straight days and lost roughly half his body weight. I called the vet, expecting them to tell me to increase his dosage. Again.
However, this time, the vet and I had a different conversation. They told me that he was entering the beginning stages of kidney failure. Many years ago, I knew this day would come, but it didn’t make receiving the news any easier. I asked the vet at what point I should put him down. Given his age and current condition, they supported the decision to euthanize him, if I felt his quality of life was poor enough.
But I really struggled with the decision, both emotionally and logically. Not only had he been my pet for nearly my entire adult life—and all of his—I felt like I couldn’t say for certain if he had more good days than bad. I didn’t feel I could confidently answer that with any degree of fairness or accuracy.
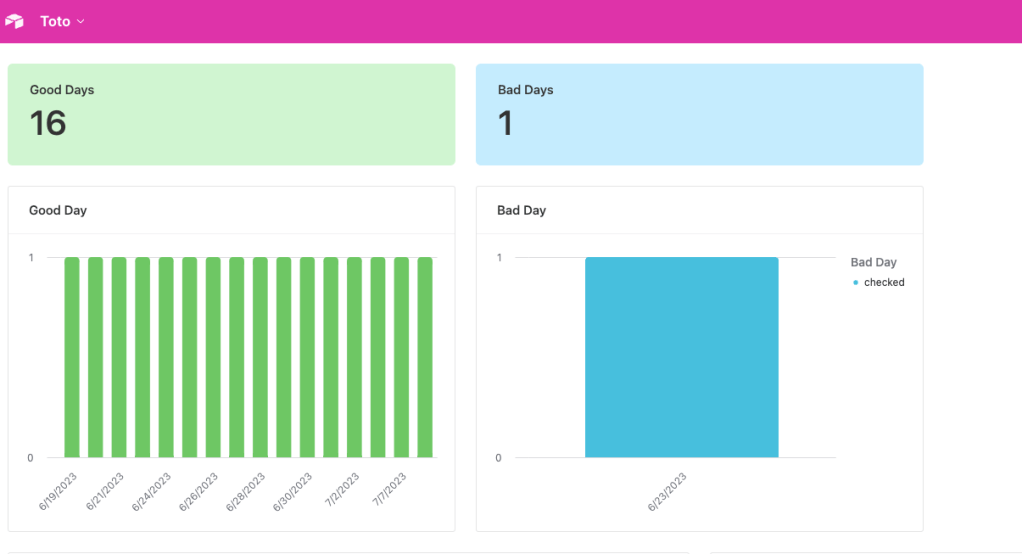
Rather than make the decision from purely an emotional state, I decided to put some of my newfound data analysis knowledge to work. Using Airtable, I built a database, complete with a dashboard, where I could track his health for 30 days and use that as the basis for my decision-making mechanism. If after 30 days, the data showed that he had more bad days than good, then I would euthanize.
I fully realize that it was an imperfect process because, in a perfect world, I would have been able to track his thyroid numbers on my own, but I am not a vet, and I do not have the knowledge or equipment to be able to do that effectively. However, I was able to gauge his demeanor and evaluate other aspects of his behavior, such as his eating and drinking habits, whether his “business” in his kitty box was healthy, and if he kept his food down, and collect data from it.
After the initial 30 days, the data showed me that for every 16 “good” days, he had one “bad” day. Sixty days later, his “good day” to “bad day” ratio improved, where he only had one “bad” day every 20 days. Six months later, he’s still alive and is doing fairly well (all things considered).
Data Saves Money—and Lives
Through my own journey of collecting, measuring, and analyzing data—something I never thought my brain was wired to do—I learned that “data” doesn’t necessarily have to be quantitative. Although in most cases it is, data can be information, qualitative, nominal, and ordinal. Toto’s health was just the beginning. I then began tracking and measuring other activities and habits in my life, such as how much coffee I waste each day.
I purchase a box of 40 Starbucks Kcups for approximately $37 on a monthly basis. On average, I drink two cups of coffee per day. However, after that second cup, there is always a little coffee left that I dump down the sink. I decided to measure how much coffee I actually waste.
So, for 30 days, after finishing my second cup of coffee, rather than dumping the remainder down the sink, I dumped it into a measuring cup and stored it in the fridge. After repeating this for four straight weeks, that little bit of coffee I dumped down the sink every day averaged out to two cups of wasted coffee per week.
Here’s where it gets good…
Let’s do some math (words I never thought I would say or write). I took $37 and divided it by 40, which comes out to approximately $0.93 per K-cup. Given that I waste an average of two cups of coffee per week, that is the equivalent of taking out a total of 8 Kcups from every new box of Starbucks Kcups and throwing them in the trash.
Now, at $0.93 a piece, that totals up to $7.44 every month, or $89.28 per year. That’s almost $100 that I just throw in the trash every year, all because I don’t finish my coffee every morning.
Why am I doing this to myself?
The moral of the story is that I never would have realized how much coffee—and money—I waste if I didn’t track and measure this data. The end result? I’m going to find a different coffee machine, one where I can brew the exact amount of coffee I know I will drink. Ground coffee also tends to be cheaper.
Data in Your Own Life
All in all, as you can see from my stories above, data analysis can be a useful tool for gathering information and facts, and using those facts to make decisions.
So whether you are curious about how much money and food you waste, your sleep quality, how many steps you take a day, OR you are a project manager managing a project, a business owner trying to understand customer satisfaction, an analyst or quality assurance professional trying to improve a process, data is the answer to everything.
As for my own data exploration journey, I have learned a lot through my own practice, but I still have a long way to go. I need to learn more about how to accurately define a problem, perform a root cause analysis, and then determine the proper metrics to track to gather the right kind of data to solve the right problem. However, I feel like building this structured thinking mindset has already helped me make better business and personal decisions.
Oh, and Toto is still alive.


One thought on “How to Make Better Decisions in Everyday Life Using Data”